Proposal update
I have spent quite a bit of the past week and a half working on updating my proposal. While there were a few small changes that Connor and I discussed, the biggest issue by far was my inclusion of line depth ratios as a method of starspot analysis. While the technique would work if we had line ratios for most of our objects, we will only have photometry data, ruling out the use of any such analysis. In place of that discussion and after talking with Connor, I will be discussing the models used to calculate the projected area of the starspots.
I have also refined my bibliography section and made minor revisions to my justifications. From our group discussion, I picked up a lot of information on why the T11 is specifically a good telescope for our efforts, and learned about different groups of supplemental data that I could use in conjunction with the Cody objects. I’m still working on if/how I should include some of those sets, but am actively looking for more papers that cover the integration of time series data from two distinct observations.
What I worked On
Improvements to reduction code
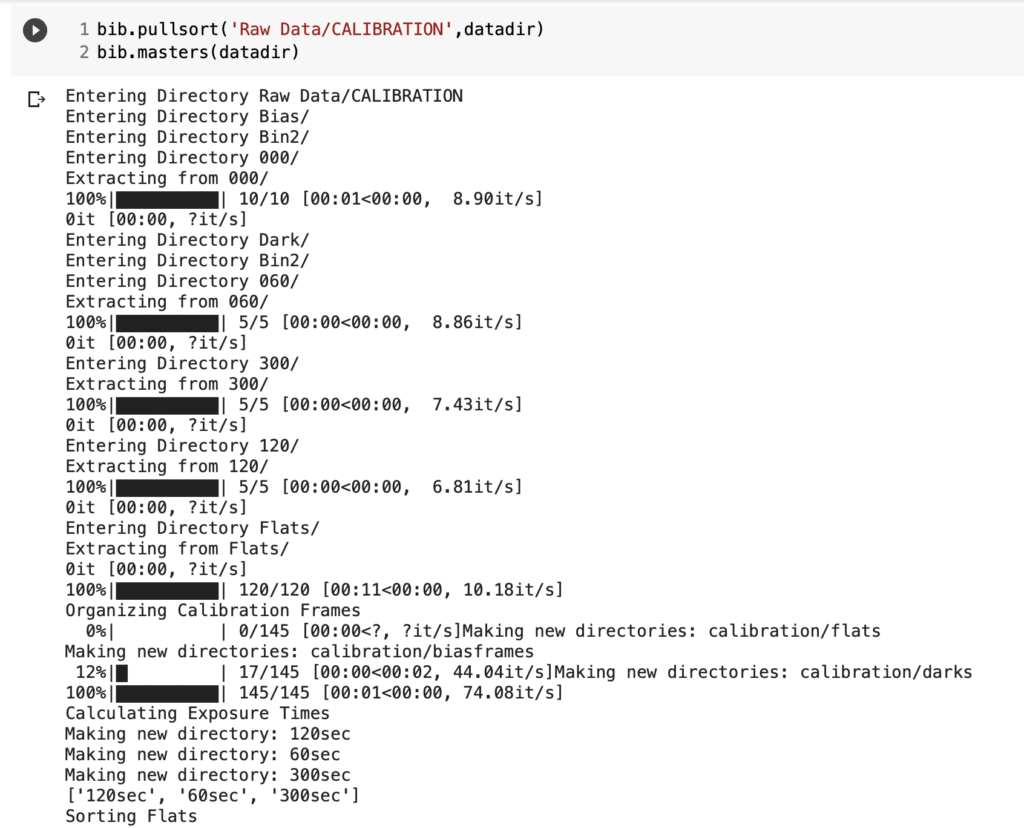
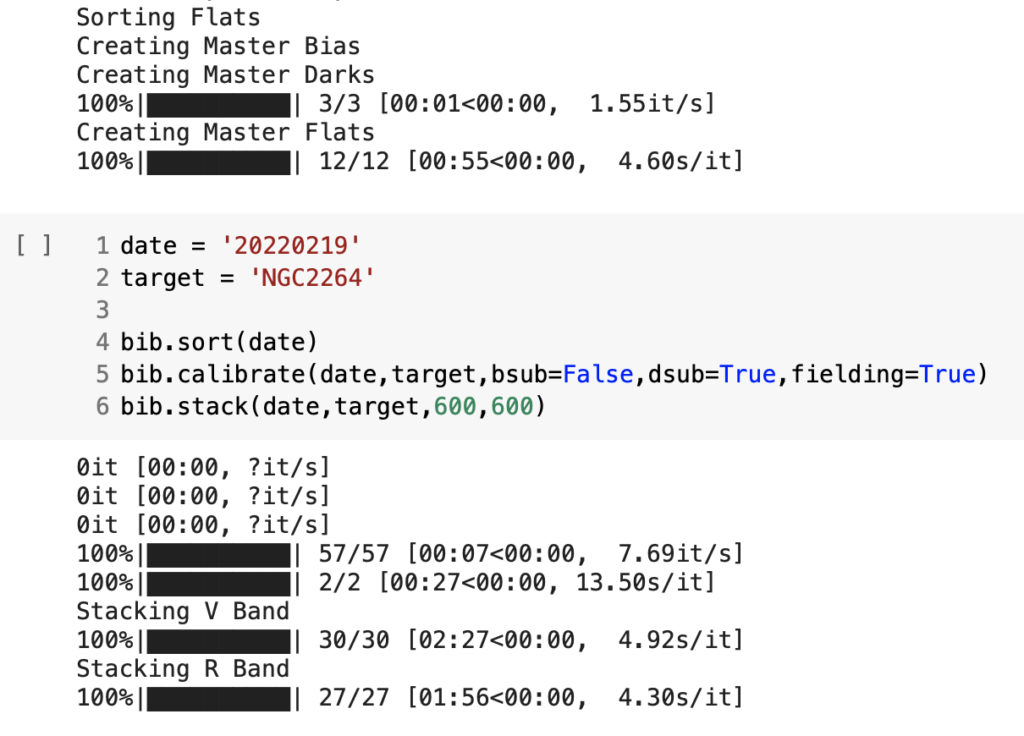
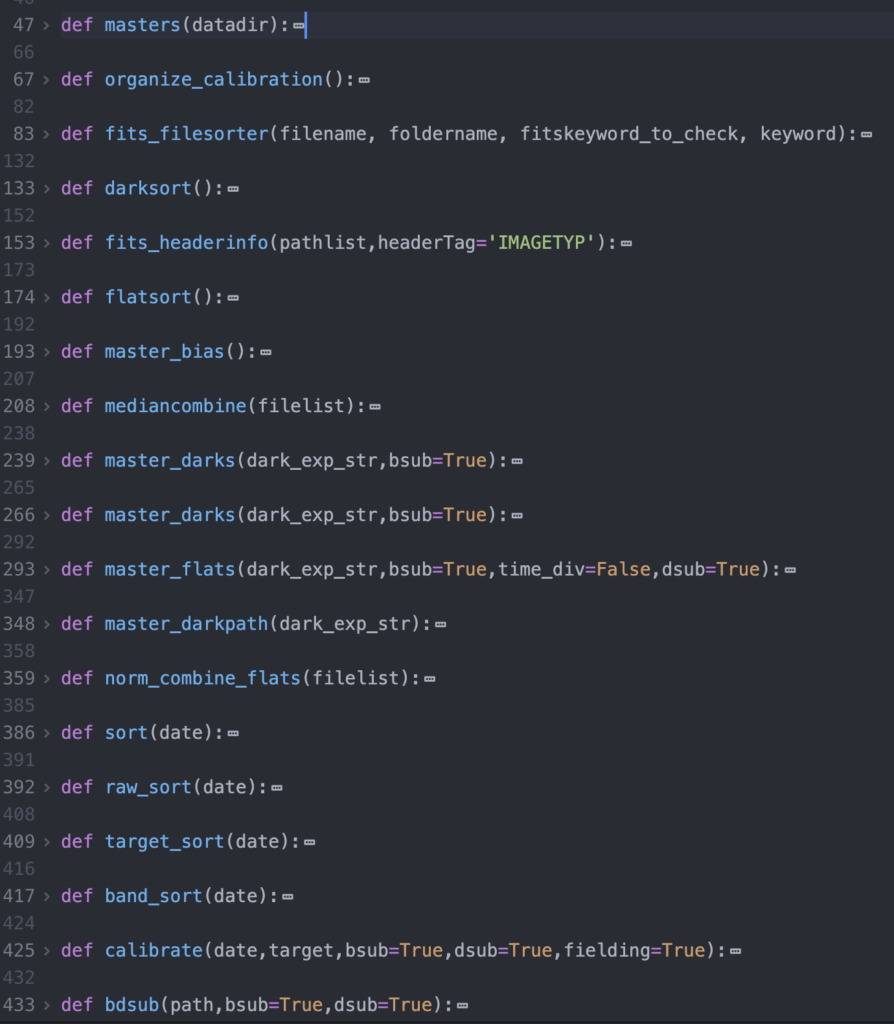
This past week, I also spent some time revising my code from my submission before break. While there were no major errors in the submission, there are a few elements that I think I could have been cleaner so that our work in the future will be more straightforward. I have restructured some of my sorting algorithms, and implemented a new method of separating images into different groups during the night so we can combine the right sets. (We didn’t know we were going to have to do this, so we didn’t implement it in the first code review.) I also spent some time adapting the astrometry code I wrote last semester to a more generalizable format in preparation for our future efforts.


What I have finalized
At this point, I think all of my reduction and stacking/aligning code is finalized. I have made a well commented module that includes all the code and can be executed in a generalizable way by only running a few lines. Overall I am incredibly happy with the work.

Next steps
My next steps in my pipeline will focus on astrometry and photometry. I am in the process of rewriting some of my code from last semester that could throw out non-cluster stars from our calculations. After we have identified all of our cluster stars, I can then begin the process of adapting all our astrometry code to find our instrumental magnitudes. From there, the differential photometry aspects should be relatively straight forward to implement, along with magnitude corrections using our single set of standard images. I think the next steps will both be straightforward and pretty fun, cause we will get to make some nice CMDs! (Maybe we can even make a time series CMD and see if we can see any changes over time!)
Reading discussion
The Honeycutt paper was very interesting to read. I had some fun puzzling over the mathematics, and as I still do not have an understanding of statistics that I am fully content with, I had a lot of fun puzzling over the stats. The first reaction I had to the paper is how smart and deviously straight forward their initial ideas were for reducing the systematic error in magnitudes. I was then surprised by the relatively in-depth mathematical discussion that followed. Overall, though, I was impressed by the methods and results they obtained, and am excited to see how well we can implement some of these techniques in our own photometry reductions.
A few questions I have: First, it seemed like they used a lot of seemingly arbitrary justifications to throw out data that they didn’t like, or data that appeared as outliers to their error estimates. I understand the impetus for such decisions, and I am sure their justification internally was sound, I am just curious what sort of assumptions we can make about our own data, and what sort of criteria we should use when throwing out an outlier. Secondly, I am still somewhat confused on how the weight calculation works. I think I have a pretty good understanding of what is being done, I just don’t intuitively understand why it works just yet. I’m sure the more time I spend with it though, the more comfortable I will feel.
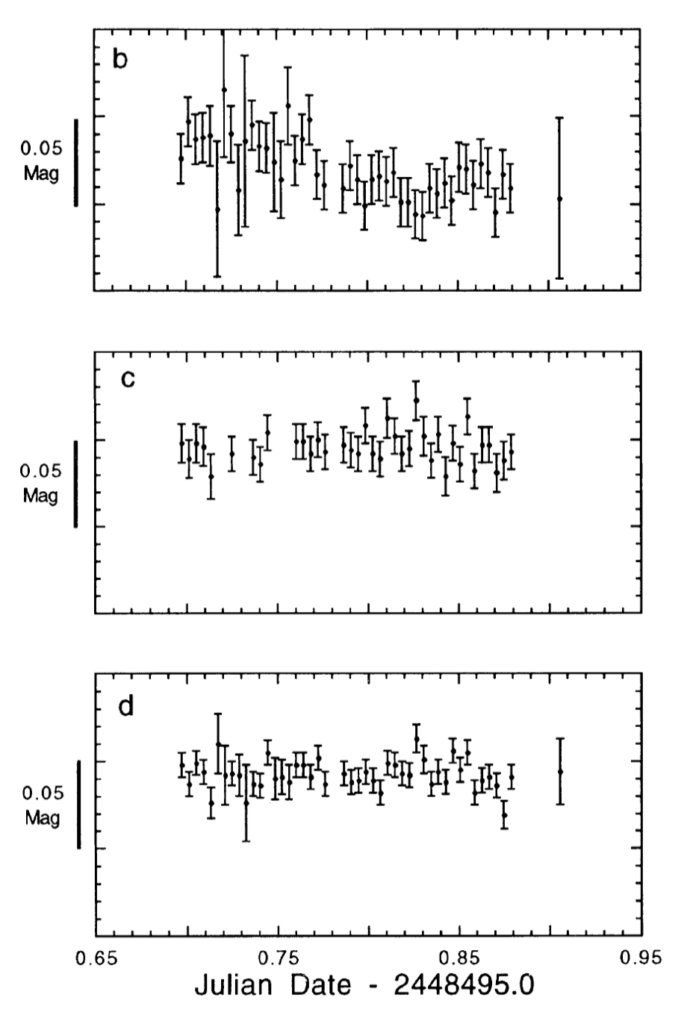
Lastly, I’ll throw in an image of my favorite graphic. It’s a pretty obvious choice, as it summarizes the main results of the paper. The first plot shows the error-bars of the original photometry, the second shows the errors when using strict ensemble photometry and the third when using inhomogeneous ensemble photometry. The clear trend across the errors as better approaches are used is evident and quite impressive.
